-
 Pocky Ye
bilibili
Interaction Design Lead for Live Product
Pocky Ye
bilibili
Interaction Design Lead for Live Product
He is currently the head of interaction at Bilibili Live Product Center. Good at sharing their strengths, improving the interaction team and the overall team battle of the entire live product center. More than 10 years of experience in the design and operation of Internet products, multiple 0 to 1 incubations, multiple cold starts to commercialization, and comprehensive and deep understanding of data operation growth system. He once worked as UED Director of Product Department of Evergrande Financial Group, and graduated from Huazhong Normal University with a Bachelor of Arts and Design.
We have been adhering to the concept of designing service products, implementing data science and design aesthetics, and striving to optimize the user experience, increase viscosity, increase payment, and promote growth; integrate culture and explore more possibilities for the perfect combination of design and products.
How to Increase the User Growth Rate of Live Streaming Platform by Interactive Design
In recent years, the development of live broadcast has grown rapidly, and its growth rate far exceeds social entertainment, short videos, Vlog, music and other online entertainment methods; and often younger netizens, the behavior habits in live broadcasts have become more mature. It has transcended the boundaries of fashion and evolved into the daily leisure and entertainment of many young people. It is an important way of life.
As a multicultural community platform for young people, Bilibili's users have unconventional attributes: they are not small but claim to be niche, eager to pay attention, and deliberately alienated. In addition to mastering big data, through deep insights into small groups and many small data common sense, to capture the unique cultural desires of this special group from bit by bit behavior, hitting the pain points and meeting the needs, is the live broadcast to maintain The secret to user growth and experience improvement.
This workshop analyzes the entire process of interactive design of live broadcast to explore how to discover the internal coherence logic of users' behavior in different scenarios, tap the deep motivation of users, and find the user-centered live broadcast industry to enhance the experience, enhance stickiness, and improve conversion. practice.
The specific content to be learned in the workshop include:
1、Trends and interactive empowerment of live broadcast platforms
1.1 Background of the live broadcast industry
1.2 Balance between immersive experience and user interaction
1.3 Tracking and measuring interactive experiences
2、Superficial behavior and deep motivation of users in live broadcast
2.1 Interaction between users in different types of scenes
2.2 Inspire mental models and user psychology in different scenarios, and tap potential problems
2.3 Understanding what a mental model is
· Why do users achieve a certain goal / achieve a certain behavior in some way
· Impact factors of user behavior
· Subconsciousness of users under the same behavior
· Finding the problem: why some live broadcasts have high popularity but low willingness to interact
2.3 Learn how to use design to influence user behavior and role transitions in different scenarios
· Understand: Know the user's product usage status through data (walk through the product data, imagine the user ’s experience differences and demands in different live broadcast formats)
· Mining: Bold assumptions, discover design opportunities (shared by the team, summarize a more reasonable situation)
· Support: Combine research to find more evidence and support the argument (small-scale interviews and tests)
· Implementation: Identify user issues, design goals and measurement methods
· Validation and analysis: observe the performance of the index data, produce hypotheses again, and identify the next iteration (analysis of the problem through the key indicators of GSM and targeted optimization)
3、"color. Accept. Think. Act. Knowledge" work effect verification
3.1 Examples to illustrate the main functions
3.2 Case introduction and analysis
1、Brief introduction of content: introduction of live broadcast industry, introduction of topics
2、Conceptual explanation: Designing persuasive interaction design
3、Practice interactive links
4、Case explanation
5、Summary review
1、Brief introduction of content: introduction of live broadcast industry, introduction of topics
2、Conceptual explanation: Designing persuasive interaction design
3、Practice interactive links
4、Case explanation
5、Summary review
1、Improve interaction design thinking;
2、Learn to mine design opportunities;
3、Through mental models and user psychology in different scenarios, tap potential problems, improve design, and stimulate user desires
-
 The main purpose of the live event
-
 Summary analysis of live event market
-
 User brand memory analysis
-
 Likelihood of affecting data
-
 The cause of the plan-thinking in watching the game
-
 Expecting optimized goals
-
 Live platform interaction path
-
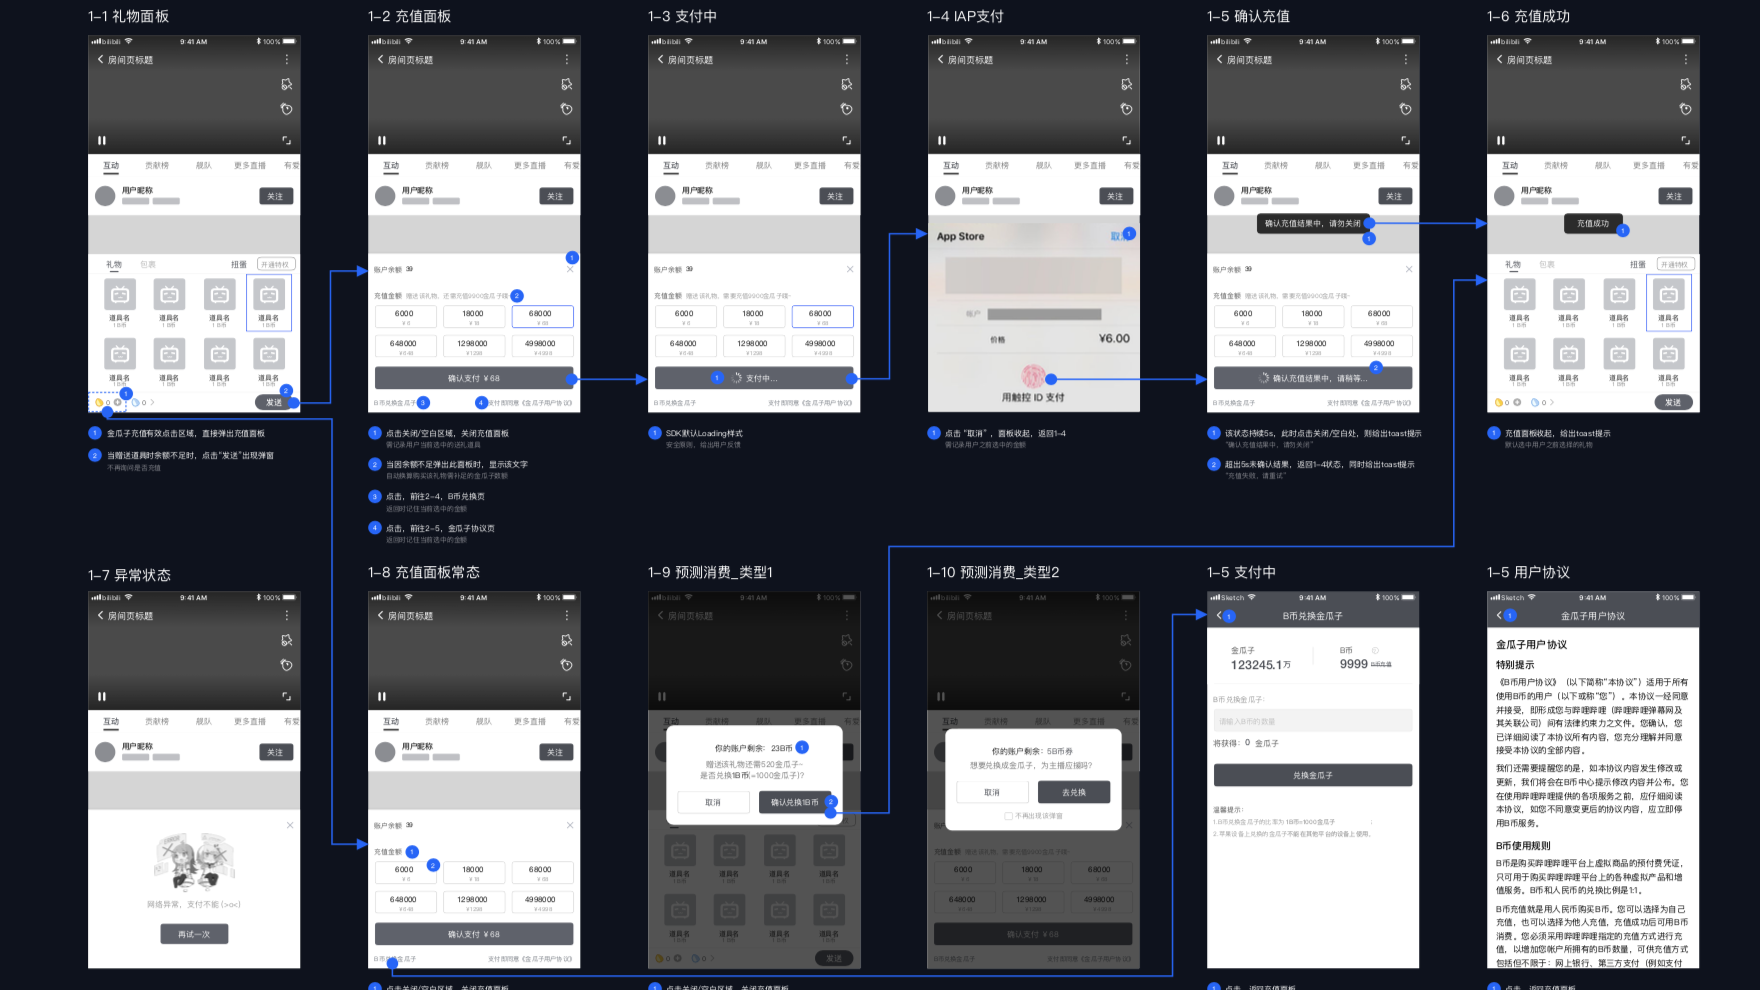
 Live interface